Main menu
You are here
Andrew Bolt on Climate Predictions

Three years ago Andrew Bolt, a political columnist for the Herald-Sun, ran a 'blog article entitled "The Worst Ten Warming Predictions". It is opportune to take stock of the predictions and to illustrate how the debate can be unreasonably skewed by those who are unfamiliar with the scientific method or are politically partisan.
This response will go test Mr. Bolt's claims point-by-point.
1. OUR CITIES WILL DIE OF THIRST
Mr. Bolt selects a number of comments by Professor Tim Flannery concerning the status of water supply in dams. For example in March 2008: "The water problem is so severe for Adelaide that it may run out of water by early 2009". Flannery made this comment in a very brief interview in the March 2008 of Jetstar magazine. In response, Bolt points out that Adelaide's reservoirs were 75 per cent full at the time of writing.
Bolt also criticised Flannery for saying "water supplies are so low they need desalinated water urgently, possibly in as little as 18 months". This is actually a truncated quote from his editorial in New Scientist. The remark was actually for Adelaide, Sydney and Brisbane. As evidence against Prof. Flannery's proposition, Mr. Bolt points out "its [Brisbane's] dams are 46 per cent full after Brisbane’s wettest spring in 27 years." etc.
Bolt he hasn't given sufficient (indeed any) consideration to the fact that Flannery's remarks are guarded propositions; "may run out", "possible in as little" etc. Scientific statements should always be expressed in this form as it deals with trends and other variables may be introduced (such as the introduction of a desalination plant). Knowledge, at least to those who know that they don't know everything, is tenuous.
Further, in seeking to counter Flannery's claims, Bolt cherry-picks particular examples, rather than using trends, a tactic typical in political rhetoric. He points out that Sydney's dams at the time were 63% full after a particularly wet June. He does the same with Brisbane which had the "wettest spring" in 27 years and that Perth had its wettest November in 17 years. Such instances are meaningless in themselves (as is pointing out individual particular hot or dry months); trends are what is is important from a scientific perspective.
Finally, as should be obvious from Flannery's remarks and the New Scientist editorial, the professor is strongly advocating the introduction of desalination plants (and/or usage reduction) to make up for declining rainfall and natural supplies. With no sense of contradiction Bolt himself notes the success of this project: "Perth now has the lowest water restrictions of any state capital [actually incorrect, that is Hobart], thanks to its desalination plant ....". So whilst criticising Flannery's concerns, Bolt is actually using Flannery's solution. I am quite unable to fathom what sort of mind engages in such a confusion.
What about data for actual rainfall over time, which is the real contributing issue? The information is easily available from the Bureau of Meteorology. My general recommendation would be to pick the longest-term data closest to catchment areas, a detailed analysis I'll leave to the people paid to do this. Data analysis is of course difficult, as there can be significant variation in individual years; perhaps the most effective method would be to take a five-year averages and a rolling mean. But a cursory look does suggest that, as being predicted, tropical areas (e.g., Darwin, Brisbane) are experiencing an increase in rainfall, and even flooding, whereas temperate areas (Perth, Adelaide, Melbourne) are facing significant declines. Further when looking at water inflow, the water collected by reservoirs independent of the desalination plants, it doesn't look so good for Melbourne and Western Australia is in serious trouble.
So yes, some cities - those without desalination plants - will indeed 'die' of thirst with current trends. Half a point to Mr. Bolt, because Prof. Flannery suggested some tropical cities which will initially receive increased rainfall due to a warming climate.
2. OUR REEF WILL DIE
Mr. Bolt criticises Professor Ove Hoegh-Guldberg for warning in 1999 of coral bleaching on the Great Barrier Reef, and in 2006 warning "between 30 and 40 per cent of coral on Queensland’s great Barrier Reef could die within a month". Mr. Bolt notes that the Global Coral Reef Monitoring Network in 2008 said there had been no big damage to the reef caused by climate change in the four years since its last report. He also refers that "veteran diver Ben Cropp said this week that in 50 years he'd seen none at all". Apparently the lesson is "Reefs adapt, like so much of nature."
Criticism can be levelled, once again, of Mr. Bolt's extremely selective and narrow use of dates and the confusion between warnings and certainties. In contrast Mr. Bolt's blithe "she'll be right, reefs adapt", is nothing short of ignorant and irresponsible. As Professor Hoegh-Guldberg responded on his own 'blog big coral deaths occurred in the western Indian Ocean in 1998 following high temperatures in 1998. There was genuine concern that the same could happen in 2006. Almost needless to say, the long-term trends indicate that the concerns are, in fact, quite real, especially given the sensitivity of coral to temperature change.
It is extraordinary that Mr. Bolt would select a mere four years from the Global Coral Reef Monitoring Report and pick, apparently as verification, the words of a "veteran diver". Instead, one should actually refer to even basic material from the GCRMN itself which quite the opposite of the pollyanna reports provided by Mr. Bolt. Indeed, one of the lead authors of the Australian and PNG chapter of the GCRMN report disputes the basic claims of Mr. Bolt.
Actual scientific research shows that in over the last 30-40 years 80% of coral in the Caribbean has been destroyed and 50% in Indonesian waters and the Pacific. Globally about 1% of coral is dying out each year. This is a recent trend; with a number of studies showing no signs of bleaching over thousands of years.
So yes, our reef may very well die with current trends.
3. GOODBYE, NORTH POLE
Mr. Bolt starts with a criticism of Dr. David Barber of Manitoba University for saying "We're actually projecting this year that the North Pole may be free of ice for the first time" and points out that the pole has bee ice-free in the past (yes, there were forests in Antarctica as well). Context is everything and Dr. Barber was referring to in historical time, as was recognised in the original article where the claim was made. As the article notes, the comment was made because much of the North Pole ice is now annual rather than perennial ice.
Mr. Bolt also targets Flannery (evidently a man he loves to hate) for claiming "this may be the Arctic's first ice-free year". A modicum of research, which should be expected of a journalist, would have revealed that it was in fact "a senior adviser to the Norwegian government was warning that this may be the Arctic's first ice-free year". Flannery's opinion is the very next line: "As I write, the rate of loss, while still well above average, has slowed somewhat. Yet even now it's impossible to predict."
In an effort to bolster his argument, Mr. Bolt points out "the Arctic’s ice cover this year was almost 10 per cent above last year’s great low" and that "sea ice in the Southern Hemisphere has been increasing", because that has a great deal to do with the North Pole apparently. In any case once again Mr. Bolt is engaging in cherry-picking. Again, this must be countered by use of trends. The U.S. National Snow and Ice Data Center, for example, displays quite clearly what the trend actually is.
If it worth mentioning there is a modest increase as a trend with South Sea Ice, an increase in (thinner, weaker) annual ice due to the ozone hole affecting weather patterns; where the hole is not present (e.g., the Antarctic Peninsula) "the effects of warming have been dramatic".
So yes, the North Pole may very well become ice free with current trends.
4. BEWARE HUGE WINDS
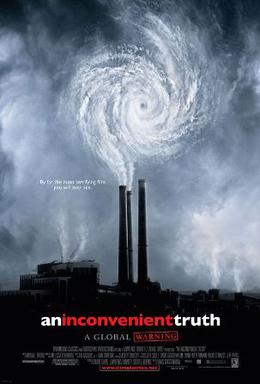
In a short response, Mr. Bolt criticised Al Gore's global warming film, "An Inconvenient Truth" for have a poster that included a hurricane. To help Mr. Bolt out, it is also worth mentioning that some artistic license was given combining emissions with a cyclonic image in the poster. Criticism at Bill Clinton is levelled for saying "It is now generally recognised that while Al Gore and I were ridiculed, we were right about global warming ... It’s going to lead to more hurricanes." The Clinton quote is unsourced, so there's no way to check how the first sentence of the quote related to the second.
However the main point for Mr. Bolt is: "In fact, there is still no proof of a link between any warming and hurricanes". But this simply isn't true; there just isn't conclusive proof. The NOAA's Geophysical Fluid Dynamics Laboratory suggests a 5-12% increase because if sea level temperature increases by 2 degrees, because "Most hurricanes do not reach their maximum potential intensity before weakening over land or cooler ocean regions. However, those storms that do approach their upper-limit intensity are expected to be slightly stronger in the warmer climate due to the higher sea surface temperatures." The debate between Landsea and Emmanuel in Nature in 2005 on how significant this increase will be illustrates some main differences (see Nature 438, E11-E12, 22 December 2005 and Nature 436, 686-688, 2005)
Will global warming cause an increase in hurricanes? We just don't know yet. Half a point to Mr. Bolt. But it is foolish and dangerous not to prepare oneself for the possibility.
5. GIANT HAILSTONES WILL SMASH THROUGH YOUR ROOF
Also coming under criticism from Mr. Bolt is Professor Ross Garnaut. Apparently under criticism from neighbours for including a curved steel roof at the rear of his property, he responded: "Severe and more frequent hailstones will be a feature of this [climate] change". Again, this is unsourced. Mr. Bolt responds that the IPCC states that "decreases in hail frequency are simulated for Melbourne...", which indeed correct. Note however that the two are not contradictory; it is quite possible to have increased hailstorms as an overall result due to climate change and a reduced level in particular parts of the world (e.g., Australia). Ross Garnaut, if such a justification was made, was correct as a general comment, but incorrect in the specific example.
In this instance, Mr. Bolt was half correct.
6. NO MORE SKIING
Again with a predilection for cherry-picking, Mr. Bolt notes that a good ski season implies that a CSIRO student that suggests that resorts such as Mt. Hotham and Mt. Buller could lose a quarter of their snow by 2020 must be incorrect. The actual report makes rather different claims:
Under the low impact and the high impact scenarios respectively, the total alpine area with an average of at least one day of snow cover decreases 10-39% by 2020, and 22-85% by 2050. The area with at least 30 days of snow cover decreases 14-54% by 2020, and 30-93% by 2050. The area with at least 60 days of cover shrinks 18-60% by 2020, and 38-96% by 2050.
At all sites, the low impact scenario for 2020 only has a minor impact on snow conditions. Average season lengths are reduced by around five days.
More seriously however (and Mr. Bolt is finally using real science) "..a study this year in the Hydrological Sciences Journal checked six climate models, including one used by the CSIRO... It found they couldn’t even predict the regional climate we’d had already: 'Local model projections cannot be credible' ... ". Except when one reads the actual paper that contains the quote used by Mr. Bolt, the snowfall study is not used. Indeed, the only local model projection in Australia that was used was from Alice Springs - a place not known for its snowfall. Further the paper does conclude that "the unsatisfactory state of the art in climatic (and hydrological) future projections does not reflect a general deadlock in related sciences, but only a wrong direction. Causality in climate and hydrology is not sequential and one-to-one but rather circular (due to feedbacks) and many-to-many (due to complexity). Such causality can be better described in probabilistic and stochastic terms (see Suppes, 1970), rather than in terms of the current deterministic climatic models and practices (see also Giorgi, 2005)."
Referring back to the originally cited CSIRO study, there are multiple references to a decline in snow depth and snow days. The hyperbolic title "No More Skiing", is indeed true, and only true, from the perspective of a 2050 high impact scenario.
7. PERTH WILL BAKE DRY
In this example, Mr. Bolt claims that CSIRO's models and warnings cannot be trusted as it claimed that Perth was "'particularly vulnerable' and had a 90 per cent chance of getting less rain and higher temperatures." In rejecting this proposition, Mr. Bolt points out that Perth "has just had its coldest and wettest November since 1991".
This remark displays extraordinary ignorance in the scientific method. Nobody should ever suggest that a single wet and cold month serves as a genuine counter to long-term evidence and trends - and nor should they suggest a single dry and hot month does so either.
A previous link has already referred to the extremely serious state of Perth's water supply. The Bureau of Meteorology explains in their 2010 report the state of Perth's temperatures (along with a wealth of other data).
If current trends continue, Perth will indeed bake dry.
8. ISLANDS WILL DROWN
Mr. Bolt claims that ABC Science Show host Robyn Williams that sea level will rise by 100m by 2100. Given that Andrew Bolt was part of the conversation his recollection could be improved. The transcript says something different:
Andrew Bolt: Dean of science...suggesting rising seas this next century of up to 100 metres, or Al Gore six metres. When I see things like that I know these are false. You mentioned the IPCC report; that suggests, at worst on best scenarios, 59 centimetres.
Robyn Williams: Well, whether you take the surge or whether you take the actual average rise are different things.
Andrew Bolt: I ask you, Robyn, 100 metres in the next century...do you really think that?
Robyn Williams: It is possible, yes.
It is possible (not even probable) that in the next century (i.e., by 2200) that sea levels could rise by 100m. Indeed, the potential loss is indeed approximately 80m.
Surprisingly, Mr. Bolt claims that "the seas have risen slowly since the last age", where instead we see a rather sudden increase (in geological time) of over hundred metres. From 3,000 years ago to the start of the 19th century sea level was almost constant, rising at 0.1 to 0.2 mm per annum; since 1900 the level has risen at 1 to 3 mm per annum; since 1992 satellite altimetry indicates a rate of about 3 mm per annum. In the IPCC's Fourth Assessment Report in 2007 the sea level is projected to rise by 18 to 59 cm by 2090-2099. Countries like the Maldives have an average ground level of 1.5m above sea level.
It is important to understand the difference between "possible" and what is likely. It is possible that sea levels could rise 80m by 2200. It is likely that they will rise between 18 and 59cm by 2099. This enough to cause serious problems to an existing country of over three hundred thousand people. Islands will indeed drown.
9. BRITAIN WILL SWELTER
Mr. Bolt considers the failure of the British Met Office to predict the 2008 winter weather as a sign that the Hadley Centre is unable to predict future climate. "If the Met can’t predict the weather three months out, what can it know of the climate 100 years hence?", he asks.
Behind this folksy humour there is a profound lack of knowledge in even the basics of meteorological prediction. Meteorologists are often incorrect in immediate predictions because of the number of variables, complexity of those variables, error involved in measuring the initial conditions, and an incomplete understanding of atmospheric processes. Weather prediction is, of course, an improving science but occasionally mistakes will be made. Sure beats the days of staring at the sky and consulting astrologers however.
Will Britain swelter? The Met provides very good historical records which does indicate that the temperature of most of the UK is indeed on the rise, albeit slowly. Is it accurate to claim that because the Met predictions are not always correct in the short-term that long-terms estimates are wrong? No, of course not.
10. WE’LL BE HOTTER
Mr. Bolt further criticises the met for predicting that 2001, 2002, 2004, 2005 and 2007 for being hotter than it actually was. He further claims that 1998 was the hottest year on record since the Medieval Warm Period and that "temperatures have slowly fallen since around 2002". The supposed lesson is that "[s]omething is wrong with warming models that predict warming in a cooling world, especially when we're each year pumping out even more greenhouse gases."
The Met making incorrect forecasts is not particularly relevant or surprising for the reasons given in the last point. It is interesting however that Mr. Bolt was quite incorrect to suggest that 1998 was the hottest year on record when in fact of the three global temperature records (HadCRUT3, NASA GISS and NCDC), only HadCRUT3 actually shows 1998 as the hottest year on record. For NASA GISS and NCDC, the hottest year on record was 2005. Further it is quite clear that global temperatures are still increasing in the longer run and from 1998 onwards with the 2010 NASA GISS data indicating an even higher global average. Obviously this means that multiple years have been hotter than the localised medieval warm period.
Yes, it is getting hotter.
Concluding Remarks
It is unsurprising that Mr. Bolt is not well versed in scientific literature, or more particularly the scientific method as this is not an area which has investigated on a formal or informal level. For example, it is basic in science that one should not cherry-pick particular examples as universal examples, a pars pro toto fallacy. Instead longer-term trends should be sought.
What is more surprising is the numerous occasions that Mr. Bolt engaged in false attributions and misrepresented qualifiers. One would expect as a fully-paid member of the chattering class that he would at least have a better level of reading comprehension than what was displayed. These mistakes can either be attributed to political partisanship or poor journalism. In either case it certainly reduces the trustworthiness of Mr. Bolt.
On items 4 and 5 Mr. Bolt is certainly partially correct, giving a grand total of 1.5 out 10 for the statements on his part. What one may make of his employer continuing to reward such poor performance is a matter deserving considered opinion.
- Log in to post comments
Comments
"Lord" Monckton
Apropos this discussion:
"Lord" Monckton is either ignorant with a strong opinion or he's a smooth liar. Regardless of which is true, his claims are simply wrong. Everyone who has an opinion on climate change should watch these videos. Heck, if you want a laugh go watch them.
http://www.youtube.com/watch?v=fbW-aHvjOgM (Part I)
http://www.youtube.com/watch?v=PTY3FnsFZ7Q (Part II)
http://www.youtube.com/watch?v=fpF48b6Lsbo (Part III)
http://www.youtube.com/watch?v=C3giRaGNTMA (Part IV)
http://www.youtube.com/watch?v=TRCyctTvuCo (Part V)
Questions from John Clonis
Tough questions need to be answered in order to justify crippling the national economy and stifling growth, prosperity and competition with the implementation of a CO2 tax. Questions like:
1) In the absence of man’s CO2’s emissions, is earth’s average temperature predictable? Does a pattern emerge?
2) What is the percentage of man’s CO2’s emissions compared to nature’s CO2 emissions?
3) What factors affect global temperatures and how influential are these factors?
4) Who is in charge of recording and analysing global temperatures? Which of these bodies are not on any government payroll?
5) How does the recording and analysing of global temperatures of today, compare before the hysteria of ACC was conceived?
6) What caused the following changes: a) The Ice Age b) the desertification of the Sahara Desert c) The drying of the Murray River over a hundred years ago?
7) Why has the term ‘Climate Change’ replaced ‘Global Warming’?
Assuming ACC is fact:
8) How does a CO2 tax help nature restore global weather back to normal?
9) How long after a CO2 tax is implemented will it take for global weather to reach a ‘normal’ level?
10) By how many degrees is the earth’s average temperature above/below the natural average?
Replies: Global Warming is Real.
1) In the absence of man’s CO2’s emissions, is earth’s average temperature predictable? Does a pattern emerge?
Despite the fact that it is non-linear and chaotic, much effort has been made and level of predictability is available, and this is well-known. Again, it is a matter of doing the minimal level of research. A good introduction is available here: http://www.cropscience.org.au/icsc2004/symposia/2/7/1189_meinke.htm
2) What is the percentage of man’s CO2’s emissions compared to nature’s CO2 emissions?
The wrong answer to this question would be to compare gross emissions. The right answer compares net C02 emissions. Gross human emissions are indeed quite small (c29 gigatons) compared to natural releases (c750 gigatons). But all the natural emissions are absorbed by land and ocean carbon sinks, as part of the carbon exchange. Natural sinks are also able to absorb 40% of current human emissions - but the rest remains in the atmosphere resulting in the highest level of C02 for some 15 to 20 million years (See: Tripati 2009 http://www.sciencemag.org/content/326/5958/1394.abstract) - for a shorter and visual timeframe see NASA (http://climate.nasa.gov/images/evidence_CO2.jpg).
Thus net human emissions compared to net natural emissions is, in percentage terms, are incalculably larger (c17 gigatons per annum versus 0 gigatons per annum).
3) What factors affect global temperatures and how influential are these factors?
On an astronomical and planetological level, the strongest overall factors are solar radiation, position of the planet from the source of energy and various atmospheric components. None of these factors provide an explanation for contemporary increases in warming. Solar activity is certainly not the cause (http://www.skepticalscience.com/pics/Solar_vs_Temp_basic.gif, Global temperature (red, NASA GISS) and total solar irradiance (blue, 1880 to 1978 from Solanki, 1979 to 2009 from Physikalisch-Meteorologisches Observatorium Davos). Overall the sun contributed to warming in the early 20th Century, but has a caused a slight cooling effect in recent decades.
Overall, greenhouse gases are the most significant contributor to temperature increases (see Meehl, Gerald A.; Washington, Warren M.; Ammann, Caspar M.; Arblaster, Julie M.; Wigley, T. M. L.; Tebaldi, Claudia (2004). "Combinations of Natural and Anthropogenic Forcings in Twentieth-Century Climate". Journal of Climate 17: 3721–7. http://www.worldcat.org/title/journal-of-climate/oclc/39656961). Relative to 1900 there has been a slight warming effect effect due to solar irradiance of approximately 0.2 degrees with volcanic forcing and sulfate emissions having a net cooling effect of 0.4 degrees. Greenhouse gases emissions have had a warming effect of approximately 1.0 degrees. The most significant greenhouse gas is water vapour, however its presence is a feedback rather than a causal factor. The amount of water vapour in the atmosphere exists in direct relation to the temperature. If you increase the temperature, more water evaporates and becomes vapour (the Clausius-Clapeyron relation) (see Kiehl and Trenberth, Earth’s Annual Global Mean Energy Budget, 1997 http://sites.google.com/site/coelhomota/RadiationBudget.pdf). The most significant casual greenhouse gas is by far carbon dioxide, followed by methane and ozone.
4) Who is in charge of recording and analysing global temperatures? Which of these bodies are not on any government payroll?
There are several thousand instrumental temperature recording devices, not including those at Antarctic research stations and satellite observations of sea-surface temperature. Global analysis is conduced by the Hadley Centre through HADCRUT3, a monthly-mean global surface temperature analysis, and NASA maintains GISTEMP, which conducts the same. The United States National Oceanic and Atmospheric Administration (NOAA) maintains the Global Historical Climatology Network (GHCN-Monthly) from thousands of land stations worldwide and National Climatic Data Center (NCDC) of surface temperature measurements. Each of these are the equivalent of independent statutory authorities and as a result their data is publically available. According to these stations, the ten hottest years of the instrumental record since 1900 are (in order): 2005, 2010, 1998, 2003, 2002, 2006, 2009, 2007, 2004 and 2001.
5) How does the recording and analysing of global temperatures of today, compare before the hysteria of ACC was conceived?
The recording and analysing today is better than it was prior to AGW concerns. We have more stations, we have more precise instruments, we have better computers to engage in modelling and data analysis. For example, when compiling temperature records, NASA's GISS goes to great pains to remove any possible influence from urban heat island effect by comparing urban long-term trends to nearby rural trends (see Hansen et al, A closer look at United States and global surface temperature change, 2001 http://pubs.giss.nasa.gov/docs/2001/2001_Hansen_etal.pdf). The uncertainty in annual measurements of the global average temperature (95% range) is estimated to be ?0.05°C since 1950 and as much as ?0.15°C in the earliest portions of the instrumental record from around 1850 (see Brohan, P., J.J. Kennedy, I. Haris, S.F.B. Tett, P.D. Jones (2006). "Uncertainty estimates in regional and global observed temperature changes: a new dataset from 1850" (PDF). J. Geophys. Res. 111: D12106. Bibcode 2006JGRD..11112106B. doi:10.1029/2005JD006548 http://www.cru.uea.ac.uk/cru/data/temperature/HadCRUT3_accepted.pdf).
6) What caused the following changes: a) The Ice Age b) the desertification of the Sahara Desert c) The drying of the Murray River over a hundred years ago?
a) Which ice age? There were several periods of glaciation in the last four hundred thousand years, each lasting about 100,000. These are punctuated by interglacial periods, which we are currently in (see http://cdiac.ornl.gov/trends/temp/vostok/jouz_tem.htm). The cause for these ice ages is a response to changes in the Earth’s orbit and tilt, which affect the amount of summer sunlight in the northern hemisphere, leading to expansion in the ice sheets, which then reflect more sunlight back into space, leading to an ice age. Given that ice sheets are in rapid retreat in the northern hemisphere it is almost certain that we are not facing an ice age in the immediate future.
b) The Sahara has been a desert for millions of years (see Schuster et al 2006, The Age of the Sahara Desert, http://www.sciencemag.org/content/311/5762/821.abstract), although there was a periods of relative lushness due to monsoonal rains after the retreat of glacial ice at the end of the last extant period. These have not been occurred for six thousand years (Geophysical Research Letters" Simulation of an abrupt change in Saharan vegetation in the mid-Holocene - July 15th, 1999, http://www.awi.de/fileadmin/user_upload/Research/Research_Divisions/Clim...), and as a result desertification gradually occurred (see Kröpelin, Stefan; et al. (2008). "Climate-Driven Ecosystem Succession in the Sahara: The Past 6000 Years". Science 320 (5877), http://www.old.uni-bayreuth.de/departments/geomorph/docs/Kroepelinetal_2...)
c) The Murray River did not dry up a hundred years ago. Gauging was established in Swan Hill in 1909 which has measured flow. For short periods in 1914, 1915 and 1923 it ceased to flow, but that's not even remotely the same thing.
7) Why has the term ‘Climate Change’ replaced ‘Global Warming’?
It general it hasn't. Both terms used frequently in the literature and have been for a long time as the following count from google books and scholar illustrates (http://www.skepticalscience.com/pics/CCvGW.bmp). As the names suggests, global warming is but one factor of climate change. The latter has great scope, as it includes changes in precipitation, changes to drought periods etc.
There has been one individual who has recommended changing the term 'global warming' to 'climate change', and that was political opinion strategist for the Republican party, Frank Luntz. From his strategy document (http://www.ewg.org/files/LuntzResearch_environment.pdf) he stated: "It’s time for us to start talking about 'climate change' instead of global warming and 'conservation' instead of preservation. 'Climate change' is less frightening than 'global warming'. As one focus group participant noted, climate change 'sounds like you’re going from Pittsburgh to Fort Lauderdale.' While global warming has catastrophic connotations attached to it, climate change suggests a more controllable and less emotional challenge.".
It is worth mentioning that Frank Luntz now accepts the mainstream science on anthrogenic global warming, although he didn't at the time of writing that strategy paper.
8) How does a CO2 tax help nature restore global weather back to normal?
For starters, it is not entirely a CO2 tax as such; there is a fixed price in the first year (which is a tax) and after that it it follows a market valuation ("cap and trade"). In either situation however, it reallocates capital resources by placing a direct price emissions which have hitherto been a negative externality. This means that emission outputs have a disincentive as the direct price will be higher. The monies raised from the price on carbon will be used (a) to compensate consumers and (b) for investments in renewable energies.
"Normal" is, of course, not the right word to use here. "Sustainable" would be more appropriate.
9) How long after a CO2 tax is implemented will it take for global weather to reach a ‘normal’ level?
Putting a price on carbon is not about targetting global emissions in itself. It is about reducing Australia's carbon footprint, which is our responsibility. As one of the world's largest emitters per capita, and the largest in the OECD, there is an expectation from the global community that we show some leadership on this issue (see http://cait.wri.org/). Total emission reductions as a result of a price on carbon will reach -80% of 2000 levels by 2050. (See Treasury, 'Strong Growth, Low Pollution' http://cache.treasury.gov.au/treasury/carbonpricemodelling/content/repor...). Without a price on carbon the estimate increase in the same period will be +82%.
10) By how many degrees is the earth’s average temperature above/below the natural average?
To quote Lindzen "We have had ice ages and warmer periods when alligators were found in Spitzbergen". So there is no "natural average" as such for the entire history of the earth as there is too much variation in external and internal forcings. The climate doesn't change just because it wants to; it changes to something forcing it to change. So the question is really what is the disparity between what the temperature would be without anthropogenic activity; as answered in question 3, that figure is roughly 1 degree and rising. Again I refer to Lynas on the effects of further change (http://www.timesonline.co.uk/tol/news/science/article1480669.ece).
More from John Clonis
Lev, thank you for your efforts in putting together a response to my questions. I did ask what other factors affect global weather, apart from carbon dioxide as you believe, and you went on to quote from a source.
Predicting global weather is a monumental task, and to assume we now have a grasp of the sheer complexity would be nonsense. Sure, meteorology has come a long way, yet meteorologists still make erroneous predictions when it comes to forecasting weather on a fortnightly basis. How then can we rely on Tim Flannery when he stated in an interview with Andrew Bolt that
“If we cut emissions today, global temperatures are not likely to drop for about a thousand years.” When Bolt asked by what margin will earth’s temperature fall by as a result of emission cuts:
Flannery: Look, as I said it will be a very, very small increment.
Bolt: Can you give us a rough figure? A rough figure.
Flannery: Sorry, I can’t because it’s a very complex system and we’re dealing with probabilities here.
Flannery is rigid about the thousand years, but the equally crucial element has a fat question mark to it. The grilling in its entirety can be accessed here:
http://www.mtr1377.com.au/index2.php?option=com_newsmanager&task=view&id...
This theorising on the part of Flannery and the rest of ACC ‘scientists’ reminds of what was said over a century ago in regards to vestigial organs. Back then, approximately 100 human organs were considered to be vestigial. As time goes on, we are discovering more and more uses of once declared ‘junk organs’. I refer you to this link
http://news.nationalgeographic.com/news/2009/07/090730-spleen-vestigial-...
We all agree that the human body is a complex system, and to claim that ‘we know it all’ is simply untrue. If anyone believes their coccyx is vestigial, then I will offer money to have theirs removed. Similarly, since weather patterns cannot be precisely measure due to our limited knowledge of the complexity involved, how then can ACC proponents be dogmatic to state that we humans are to blame for Lady Gaia’s demise?
What will Gillard, the Fabian think of next? Here’s an idea...”Let’s put a price on all heterosexuals, because they have the potential to produce offspring that will tarnish the earth with a carbon footprint”. Music to Brown’s ears
Further replies
It is a fact of complex and chaotic systems that short term predictions are less likely to be accurate than longer-term trends, given the same instrumental record. In other words, metereologists, despite their heroic efforts, are going to have less success in predicting whether it will be hotter or colder tomorrow than climatologists making the same assessment on a scale of twenty years, ceteris paribus.
As for the Prof. Flannery quote, also available at (http://blogs.news.com.au/heraldsun/andrewbolt/index.php/heraldsun/commen...) I am increasingly unsurprised by Mr. Bolt's lack of comprehension. I confess I very rarely read Mr. Bolt as his consistent inability (and lack of desire) to grasp either science or English makes him a very poor choice from which to form an opinion. Again, I emphasis the importance of referring to scientific sources rather than tabloid media (cf., http://theconversation.edu.au/the-false-the-confused-and-the-mendacious-...)
However, back on topic, the selective quote from Prof. Flannery is a direct response to Mr. Bolt's question on the questions on how Australia's emissions price would affect global warming. In that context Prof. Flannery's remark that it is a bogus question is correct, as is the answer that it wouldn't be likely to cause a drop in a thousand years. We are not responsible for the world's actions on the human effects on climate change. We are responsible for our own, and we can display leadership on this issue. By way of analogy (which I normally hate using), if a thousand people in a our suburb are tipping their rubbish out in the streets, that is still no excuse for us to not to use a bin.
Climatologists are well aware that they do not know it all. That is why the IPCC makes guarded comments to indicate probabilities. For example, the panel defines "very likely," "extremely likely," and "virtually certain" as indicating probabilities greater than 90%, 95%, and 99%, respectively. That is why predictions of the extent of change by the end of this century (again, ceretis paribus) varies from a 4.7 degree increase (CCSR/NIES) to a 2.2 degree increase (NCAR CSM). (see http://www.ipcc.ch/publications_and_data/publications_ipcc_fourth_assess...).
I have no comment to make on your speculative fantasies of a "price on heterosexuals".
Re: Responsibility - two letters from 'The Age'
'Tit for tat' strategy
JASON Fong's leading question in The Sunday Age points out that a cut to Australia's CO2 emissions of 5 per cent will reduce global temperatures by only a small amount.
His question conveniently ignores two things: First, Goethe wrote: ''Let everyone sweep in front of his own door, and the whole world will be clean.'' Second, if you are a student of game theory, you would know that if you have a group of individuals who have to undergo hardship for the group to benefit, the best strategy for each individual is to co-operate and undergo the hardship, only opting out if other individuals welsh on their commitment. This is called the ''tit for tat'' strategy, and it is the basis of successful altruistic behaviour. You could call it the ''be nice first, but get tough if others mess you around'' strategy.
Australia has to act altruistically and incur significant economic costs in cutting emissions if it is going to play its part in the global ''we need to cut CO2 emissions'' game. Game theory dictates that any alternative will mean that the entire world, including Australia, will suffer appallingly. Jason, there is no other choice.
ANDREW ROTHFIELD, Hawthorn
No excuses
MICHAEL Bachelard's informative article shows that Australia's contribution to greenhouse gas emissions is 1.5 per cent of the global total. More interestingly, it shows that there are only 10 nations with higher total emissions. Australia, together with other nations with equal or lower emissions, accounts for about 38 per cent of the total, slightly more than the US and China combined. Is anyone really suggesting that Australia and the rest do nothing? Australia has no excuse. We are the world's highest per capita emitter and we export large quantities of coal. We also have great solar, wind and geothermal resources. As one of the world's richest nations, we are well placed to absorb the costs of addressing climate change. We are constantly told we punch above our weight in world affairs. Now is the time for us to do our bit.
PETER LYNCH, Kew
http://www.theage.com.au/national/letters/the-big-issue-climate-agenda-2...
The Debate
What I don't get about this so-called carbon-tax debate is how distinct the costs are between the policies of the two major parties. Labor's policy is, in a nutshell, charge the polluters, split the money between you and renewables.
The Coalition's policy is tax you, give the money to corporations who might develop something that works.
Both are seeking 5% less emissions at 2000 levels by 2020).
But one costs twice as much as the other.
http://www.theage.com.au/environment/climate-change/abbott-plan-would-do...
Sweden is proof carbon tax works
http://news.theage.com.au/breaking-news-world/global-resource-consumptio...
GLOBALLY, the climate change issue is taken ever more seriously; many countries are doing their bit. The first carbon tax in Sweden was introduced on January 1, 1991. I was a member of the Swedish parliament and its standing committee for taxation. The proposal that gained majority support replaced the excise on petrol with a tax corresponding to roughly $100 per ton of carbon dioxide.
After 20 years the effect is clear. The Swedish Institute for Communication Analysis has estimated that in the period 1990-2005, carbon dioxide emissions from road traffic has decreased by more than 1.5 million tonnes a year. There has also been a healthy reduction in fuel usage for heating.
Many countries have a carbon tax, which has been shown to reduce emissions effectively. Like Australia, Sweden is only a small contributor to the global threat of climate change, but like Sweden, Australia should join other countries in doing its best for a healthy future.
Gosta Lynga, Duffy, ACT
Item 2: Our Reef Will Die
Thanks Andrew Bolt, you lying wanker.
A sobering study released today shows more than half of Australia's Great Barrier Reef has disappeared over the past 27 years.
Scientists from the Australian Institute of Marine Science in Townsville have found the loss of coral is caused mainly by cyclones and crown-of-thorns starfish.
Coral bleaching is also to blame.
http://www.abc.net.au/news/2012-10-02/barrier-reef-coral-cover-halved-re...
In hindisght
Andrew Bolt didn't seem to be too keen on desalination plants.
With the benefit of hindsight we can look at the desal plants that have been built, what percentage of the water supply they provide, and when they were completed.
Gold Coast Desalination Plant 125 megalitres 27% of the water supply. (2009)
Perth Seawater Desalination Plant 130 megalitres 17% of the water supply. (2006)
Sydney Desalination Plant 250 megalitres 15% of the water supply. (2010)
Victorian Desalination Plant 410 megalitres 33% of the water supply. (2012)
Southern (Perth) Seawater Desalination Plant 270 megalitres 20% of the water supply. (2012)
Adelaide Desalination Plant 270 megalitres 50% of the water supply. (2012)